Commodity Channel Index (CCI): Formula, Signals & Uses
Most CCI guides stop at the formula. This guide adds a worked example, its real limits, and how Pakistani commodity traders use it with live prices.
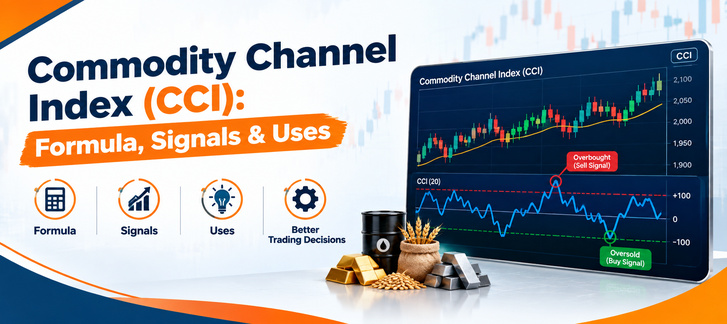
Quick answer: Donald Lambert built the Commodity Channel Index back in 1980, and at its core it's just a momentum oscillator: it tells you how far a commodity's price has drifted from its own statistical average.
Push above +100, and you're usually looking at a strong uptrend, maybe overbought territory. Drop below −100, and it's the opposite: a strong downtrend, possibly oversold.
Funny enough, despite the name, traders don't just use this on commodities anymore; it's ended up on stock charts, currency pairs, indices, pretty much everywhere.
If you trade or procure physical commodities, at some point you've probably seen a chart with a jagged orange line bouncing between two dashed levels marked +100 and −100.
That's the commodity channel index, one of the older technical indicators still in daily use, and one that was actually built for commodities before traders
borrowed it for stocks and currencies.
This guide walks through what CCI actually measures, how to calculate it by hand, the trading strategies built around it, and where it realistically breaks down.
Towards the end, we'll also cover something most CCI explainers skip entirely: how this indicator connects to the kind of physical commodity price-watching that Pakistani buyers and traders do every day on markets like cotton, sugar, and energy.
What Is the Commodity Channel Index?
Definition: At its simplest, the CCI is an unbounded momentum oscillator, meaning it compares wherever a security's price sits right now against its average over some chosen period. Donald Lambert put it together in 1980, and the original goal was to catch cyclical turns in commodity markets.
That basic idea hasn't really changed since: price climbs well above its recent average, the CCI reading climbs with it. Price falls well below that average, the reading falls too.
Unlike bounded oscillators such as the RSI, which is capped between 0 and 100, the commodity channel indicator has no fixed ceiling or floor.
Lambert scaled the formula so that roughly 70–80% of readings fall between −100 and +100 in normal conditions, which is why those two levels became the standard reference lines for overbought and oversold behaviour.
How the CCI Works
At its core, the CCI is a distance measurement. It asks one question: how far has today's typical price strayed from its recent average, relative to how much the price normally moves around that average?
When the CCI crosses above +100, price is running well above its recent average, read as the start of a strong uptrend or an overbought warning, depending on the strategy being used.
When the CCI crosses below −100, price has dropped well below its recent average, read as a strong downtrend or an oversold warning.
Readings between −100 and +100 are considered the indicator's normal range, where price is moving within its usual variability, and no strong signal is present.
Because the CCI is unbounded, it can spike to +300, −250, or beyond during genuinely extreme moves — a trait bounded oscillators don't share.
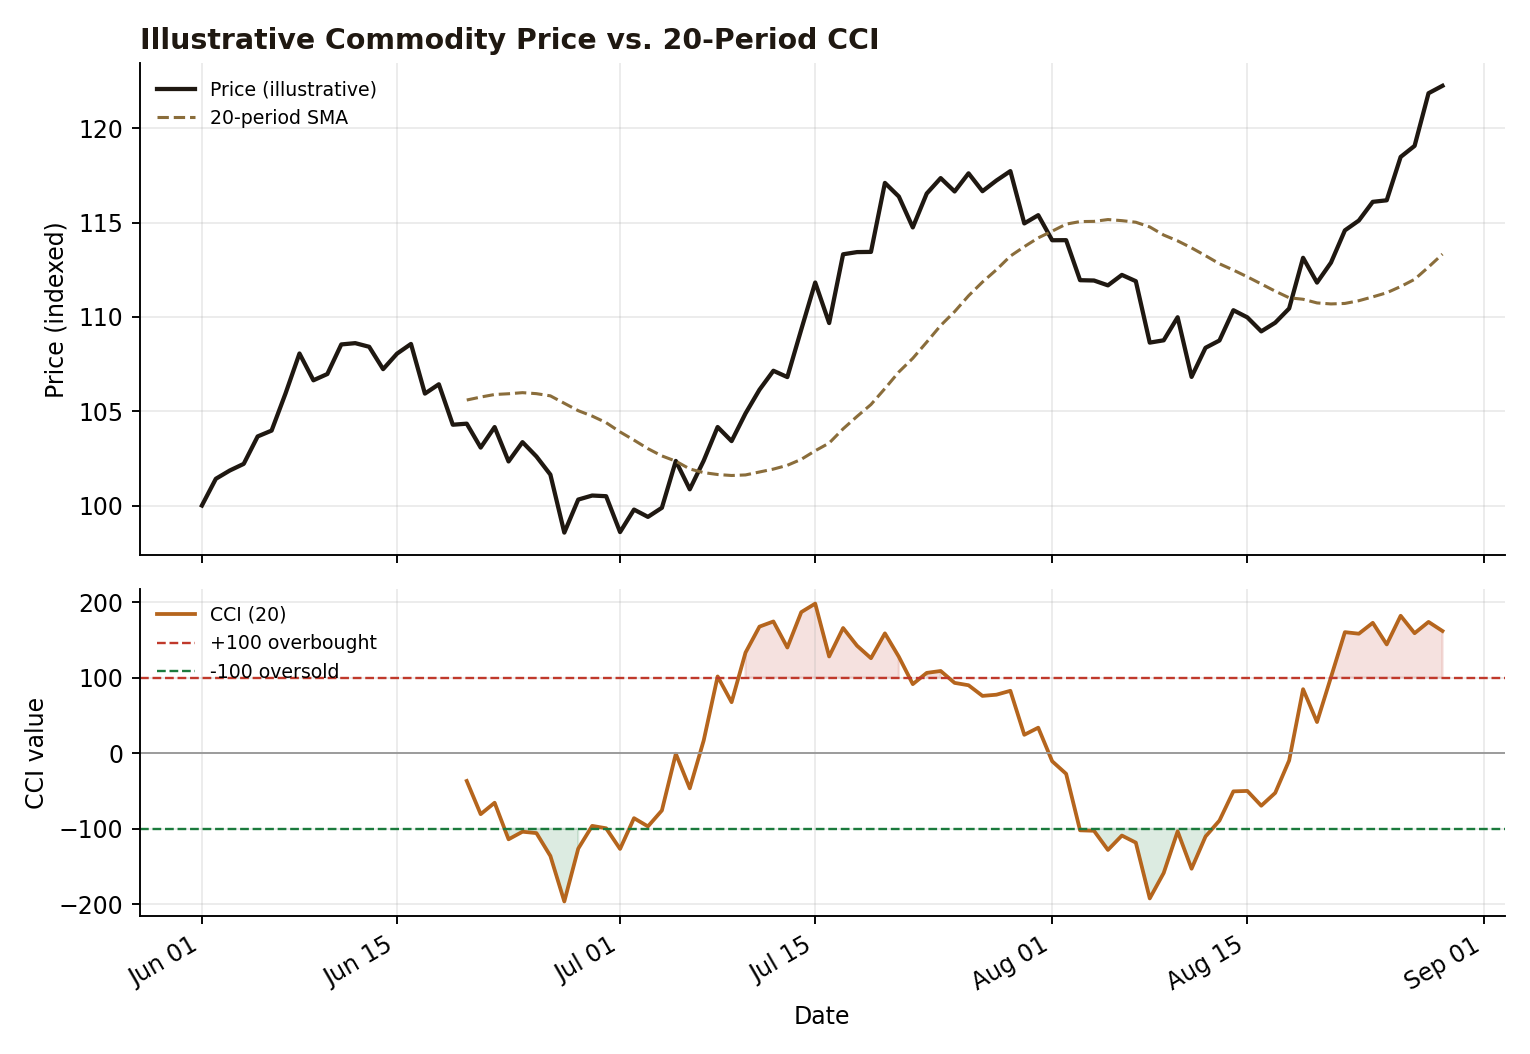
The chart below shows this in practice on an illustrative 90-day price series (not live market data), with a 20-period CCI plotted underneath. Notice how the CCI
pushes through +100 during the sharpest rallies and through −100 during the sharpest pullbacks, then drifts back toward zero as price consolidates.
Calculation Formula
The CCI formula has three building blocks: the typical price, its simple moving average, and its mean deviation.
CCI = (Typical Price − SMA of Typical Price) ÷ (0.015 × Mean Deviation)
Typical Price (TP) = (High + Low + Close) ÷ 3 for the current period.
MA of TP = the average of the typical price over the last N periods (commonly 14 or 20).
Mean Deviation (MD) = the average of the absolute differences between each period's typical price and the SMA, a way of measuring how much price typically wanders around its own average.
0.015 is Lambert's scaling constant, chosen specifically so most readings land inside the −100 to +100 band.
A Worked Example
Here's the arithmetic in full, using a simplified 5-period example so each step is easy to follow (in practice most traders use 14 or 20 periods; the formula works either way identically).
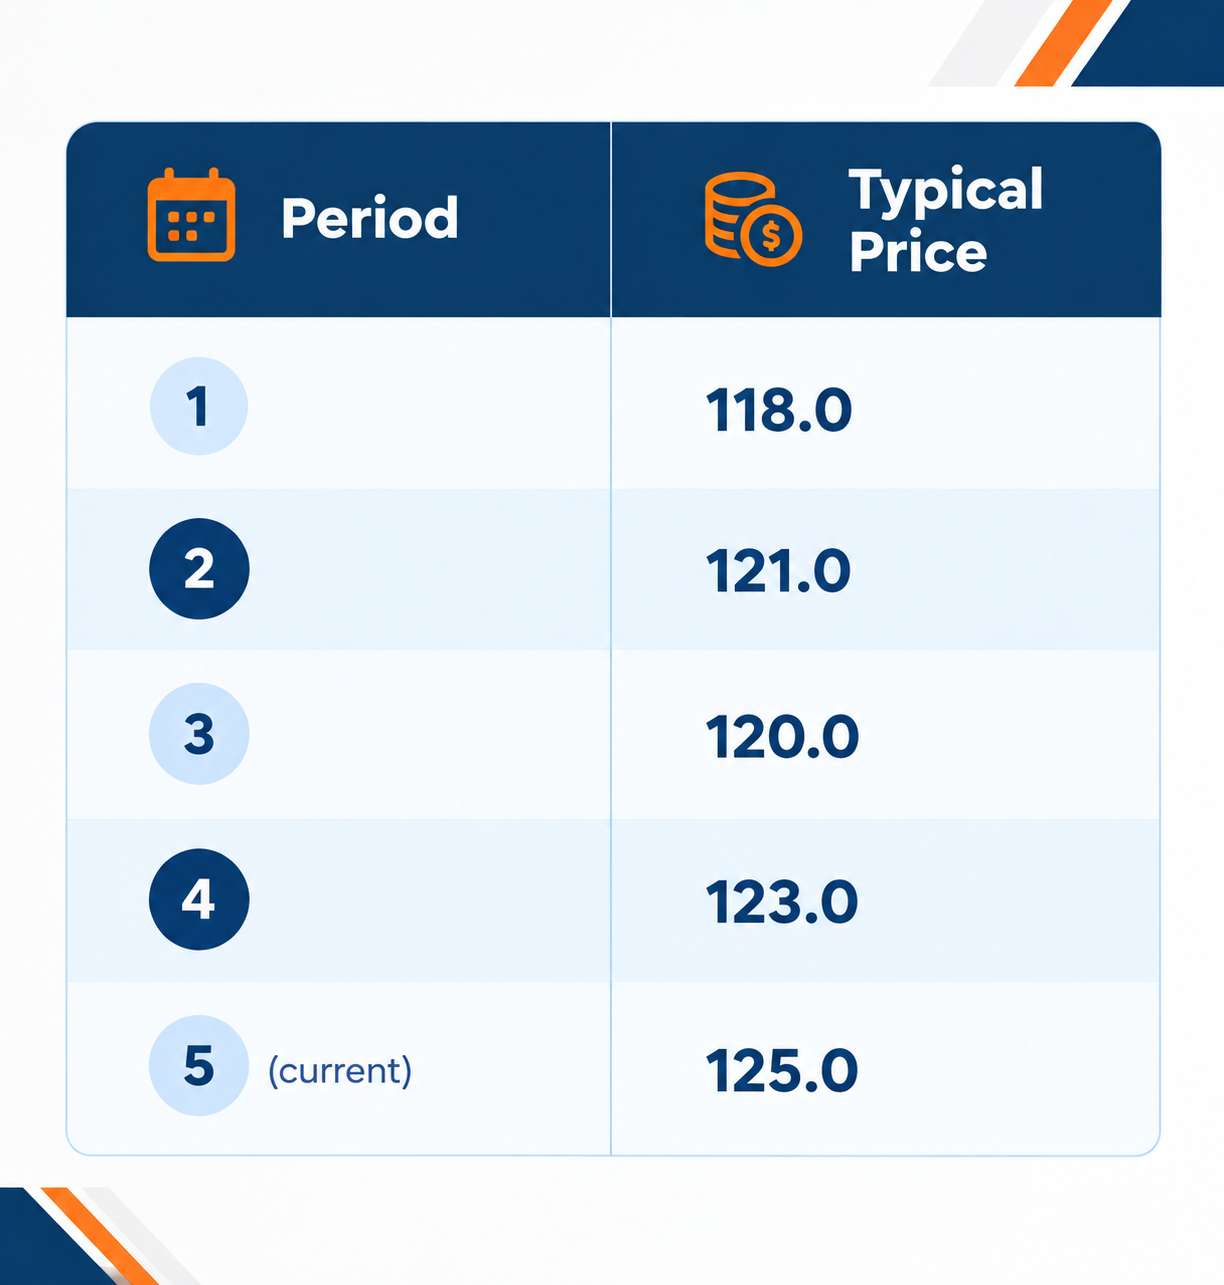
SMA of TP = (118 + 121 + 120 + 123 + 125) ÷ 5 = 121.4
Mean Deviation = average of |118−121.4|, |121−121.4|, |120−121.4|, |123−121.4|, |125−121.4| = (3.4+0.4+1.4+1.6+3.6) ÷ 5 = 2.08
CCI = (125 − 121.4) ÷ (0.015 × 2.08) = 3.6 ÷ 0.0312 ≈ 115.4
A reading of roughly +115 has just pushed through the +100 line, which is exactly the kind of move a crossover strategy is built to catch, covered next.
How to Read CCI Signals
Lambert's original method was simple: treat +100 and −100 as breakout triggers rather than fixed overbought/oversold ceilings. A move above +100 signals the start of a strong uptrend; the position is held until the CCI drops back below +100.
A move below −100 signals a strong downtrend, held until the CCI rises back above −100. Because roughly 70–80% of CCI values sit between those two lines, a live buy or sell signal is only in force 20–30% of the time, which is precisely the point, since it filters out routine noise.
Since then, traders have layered on additional ways to read the same line: divergence between price and the CCI, and breaks of trend lines drawn directly on the CCI itself.
Common CCI Trading Strategies
1. Zero-Line and ±100 Crossover Strategy
This is the strategy most new traders start with, and it's also the one built into Lambert's original guidelines. A buy signal fires when the CCI crosses up through −100 from an oversold zone, or up through the zero line during an established uptrend.
A sell signal works the same way in reverse. Because it relies on a clean cross of a fixed level, it's easy to automate and easy to backtest, which is also why it's the version most commonly tested in the studies covered in the settings section below.
2. Overbought/Oversold Reversal Strategy
Here the +100 and −100 lines are treated as extremes rather than breakout triggers. A trader watches for the CCI to dip below −100 and then curl back above it as a buy signal, or push above +100 and fall back below it as a sell signal. This version tends to suit range-bound or mean-reverting markets better than strongly trending ones.
3. Divergence Strategy
If price makes a new high but the CCI fails to make a matching high, that's bearish divergence, a warning that upward momentum is fading even though price hasn't turned yet.
The mirror case, price making a new low while the CCI holds higher, is bullish divergence. Divergence signals are generally used to add confidence to another signal, not as a standalone trigger.
4. Trend-Line Break Strategy
Because the CCI itself forms peaks and troughs, some traders draw trend lines directly on the indicator, the same way they would on a price chart. A break of that trend line, especially from an oversold or overbought zone, is read as an early sign that a reversal is building before price confirms it.
Best CCI Settings for Trading
There isn't really a "correct" period, no matter how many guides act like there is. It depends on your timeframe, and honestly, how much noise you can put up with before it starts messing with your head.
Shorter periods react quicker, sure, but you'll be dealing with a lot more false alarms along the way. Push the period longer and things calm down a lot, the tradeoff being you're a step slower to actually confirm something's happening.
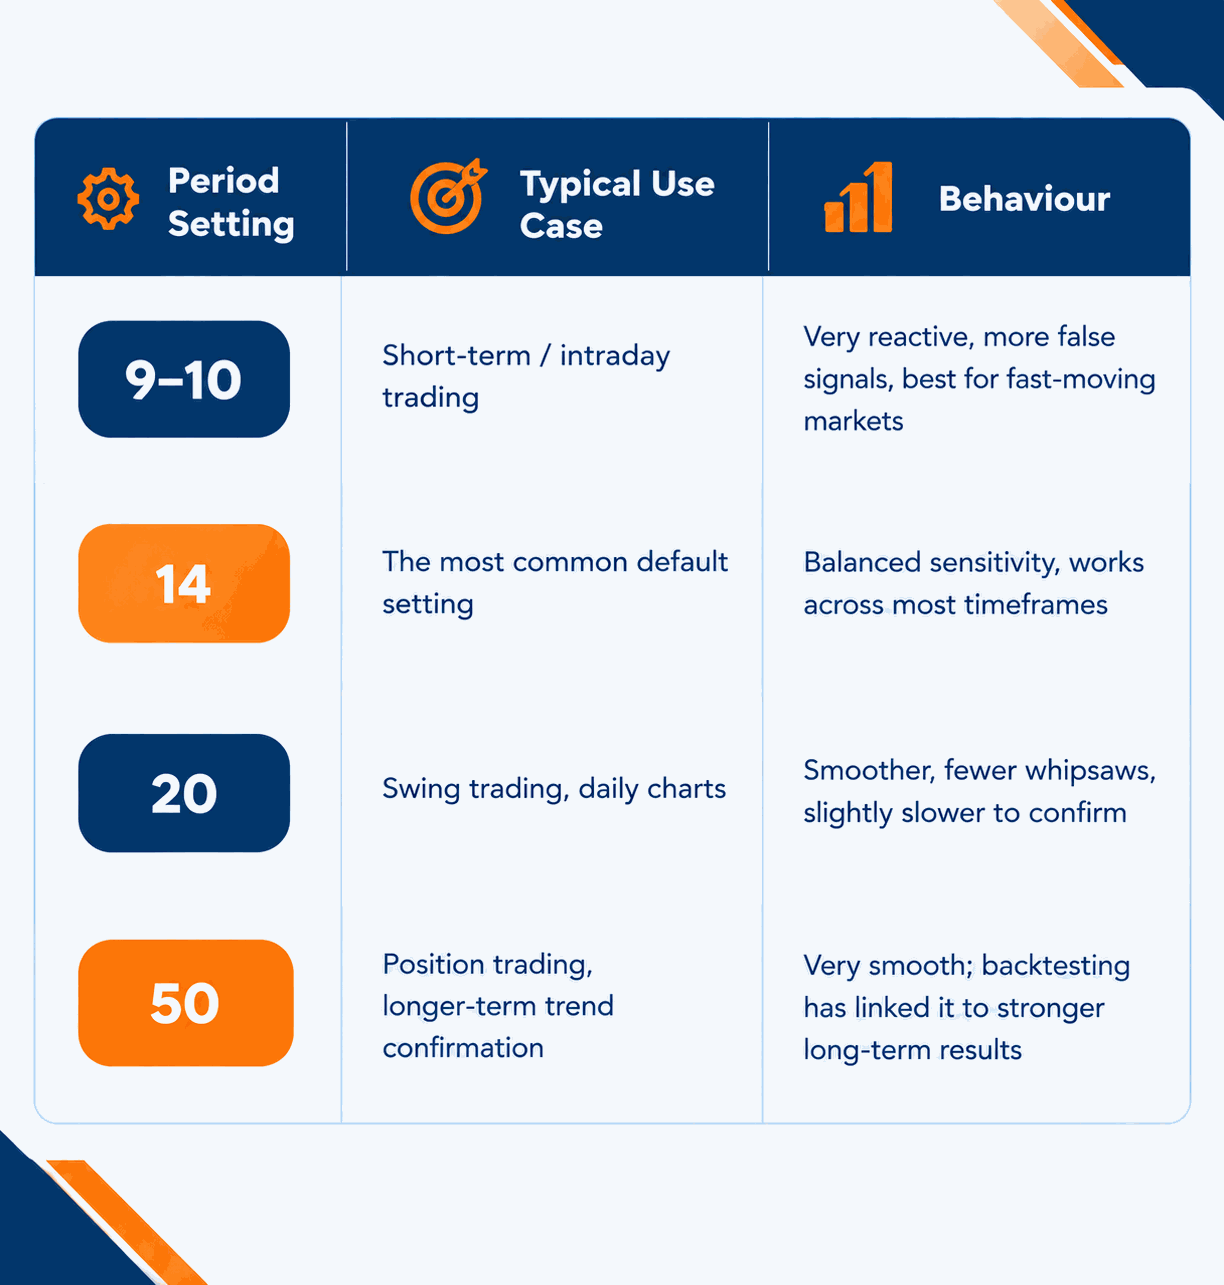
One of the more rigorous studies on this, a backtest of 43,297 trades across 20 years covering the S&P 500 (2003–2023), found that a CCI(50) crossing up through −100 on a daily chart outperformed a simple buy-and-hold approach, according to research published by Liberated Stock Trader.
The same research also found that using CCI on very short timeframes, such as 5-minute charts, performed poorly. That's a useful reminder that a setting which works well on one timeframe can fail on another, so it's worth testing a setting on the specific market and horizon you actually trade, not assuming a single number works everywhere.
CCI vs RSI: Which Is Better?
CCI and the Relative Strength Index (RSI) are both momentum oscillators, but they're built differently and answer slightly different questions.
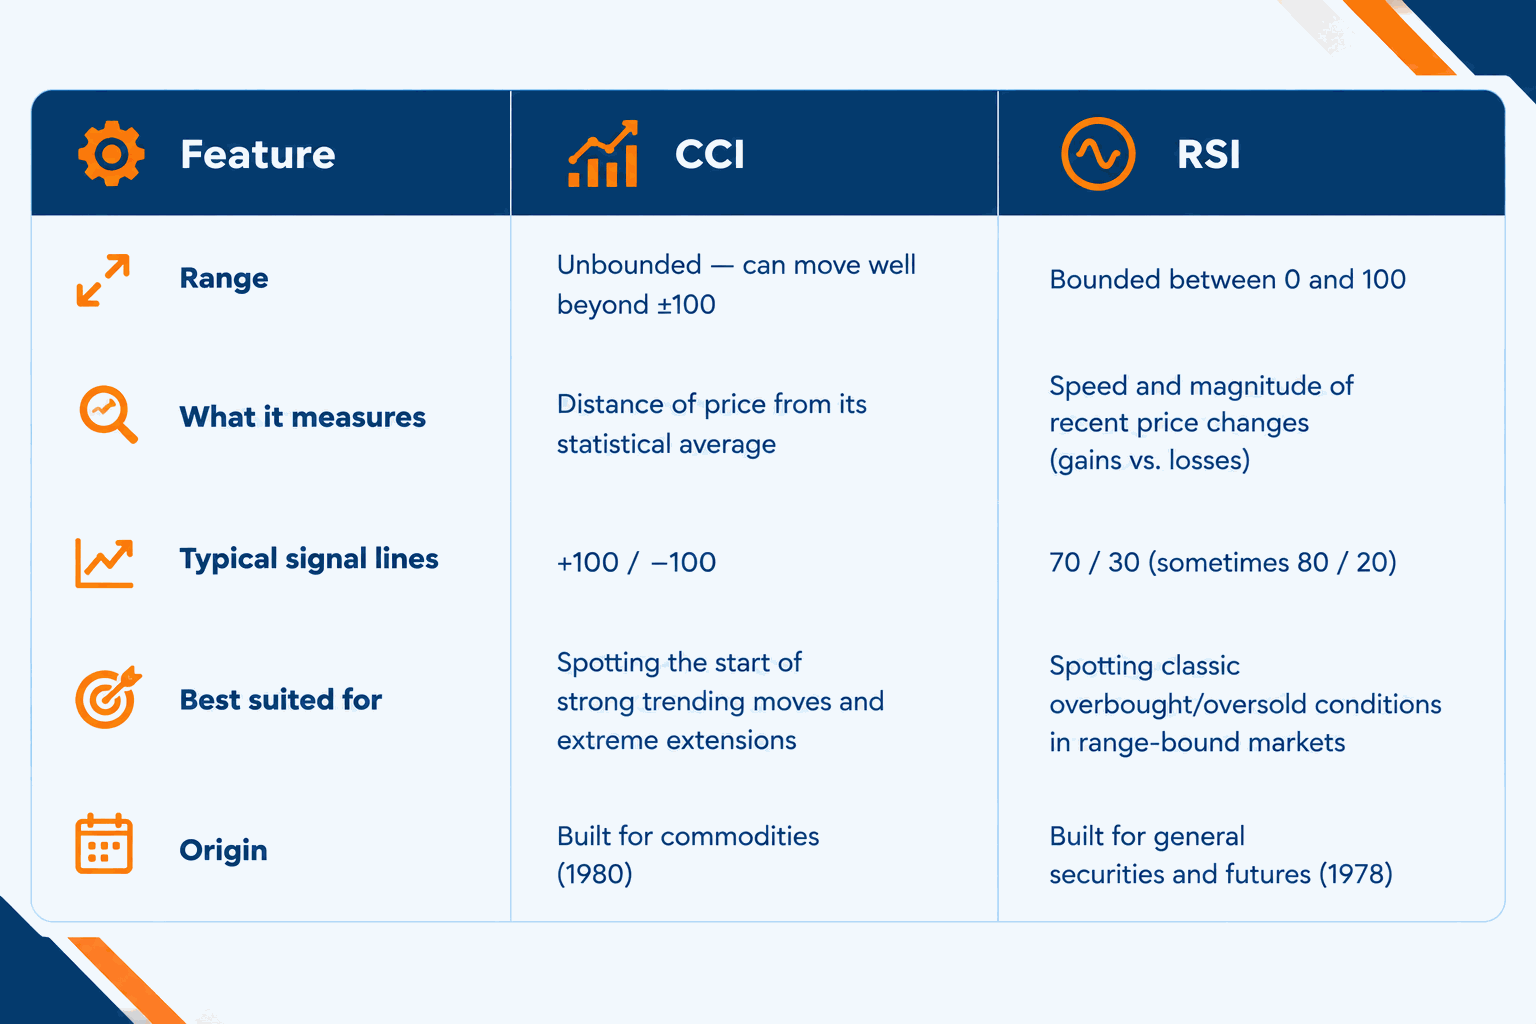
Neither is objectively “better”; they tend to be strong in different conditions. CCI's unbounded nature makes it more useful for catching the early stage of a powerful trend, since it can keep climbing well past +100 in a genuine breakout rather than flattening out the way a bounded oscillator does.
RSI tends to be steadier in sideways, range-bound markets where its fixed 0–100 scale gives more consistent overbought/oversold reference points. Many traders run both side by side and treat agreement between the two as a stronger signal than either alone.
Limitations of the Commodity Channel Index
CCI is genuinely useful, but it isn't a standalone trading system, and it's worth being upfront about where it struggles.
Whipsaws in choppy markets: in sideways, low-momentum conditions, the CCI can cross +100/−100 repeatedly without any real trend developing, generating false signals.
Unbounded readings cut both ways: because there's no ceiling, an “overbought” reading can stay overbought for a long time in a strong trend — closing a position purely because the CCI is “high” can mean exiting a winning trend too early.
Lag from the moving average: like any indicator built on a moving average, the CCI reacts after price has already moved, not before.
Works best with confirmation: most experienced traders pair CCI with a second signal, such as price action, volume, or a trend-following indicator, rather than trading its crossovers in isolation.
None of this means the CCI isn't worth using — it means treating it as one input in a broader process, which is true of every technical indicator, not a flaw unique to this one.
Using CCI to Read Physical Commodity Markets in Pakistan
Most CCI explainers stop at stocks and forex charts, but the indicator was literally built for commodities, and that's still where it has a practical use most guides skip: helping a buyer or trader read price cycles on the physical commodities they actually deal in.
A cotton mill deciding when to lock in a forward purchase, a sugar trader watching for a seasonal turn, or an energy buyer timing a bulk order all face the same problem: prices move in cycles, and it's easy to buy right after a spike or sell right before a recovery.
Watching a momentum reading like the CCI alongside actual market prices, such as the figures on Zarea's Daily Price page, gives a second, independent signal for whether a commodity is trading well outside its recent normal range before committing to a large order.
It doesn't replace fundamentals, supply data, or your own market knowledge; it's a cross-check on timing.
This applies across the commodities Zarea's marketplace covers, from cotton and yarn and sugar to energy and petroleum. If you're new to how crude oil pricing itself moves through benchmarks like Brent and WTI before it reaches Pakistani buyers, our guide on what crude oil is and how it's refined covers that chain in detail.
Worth being clear about: CCI is a trading and market-timing tool, not a procurement or investment recommendation. Sourcing decisions on physical commodities should still weigh supply contracts, quality specifications, logistics, and your own risk tolerance; the indicator is one extra data point, not a substitute for them.
Frequently Asked Questions
How is the CCI calculated?
Three steps. Typical price is high plus low plus close, divided by three. Then take its moving average over 14 or 20 periods, and work out the mean deviation: how far each typical price sits from that average. Then: CCI equals (Typical Price minus SMA) divided by (0.015 times Mean Deviation). The 0.015 just keeps most readings between −100 and +100.
What is a CCI crossover strategy?
Trading off the indicator crossing a fixed line, usually +100, −100, or zero. Lambert's version: cross above +100, that's a buy, held until it drops back below. Cross below −100, that's a sell. Some traders just use zero instead; simpler, but noisier.
Which is better, CCI or RSI?
Depends on the market. CCI has no ceiling, so it catches strong trends early. RSI stays between 0 and 100, better for overbought/oversold turns in sideways markets. Plenty of traders just run both together.
What is the best CCI setting for trading?
14 periods is the standard default. Go shorter, like 9 or 10, for faster but noisier signals. Go longer, 20 or 50, for smoother, slower confirmation; a 20-year backtest on 43,000+ trades found 50-period CCI beat buy-and-hold on the S&P 500, though 5-minute charts did poorly in the same study. Test it on what you actually trade.
Wrap Up
So, quick recap before you go. The CCI is Donald Lambert's 1980 creation, an unbounded momentum oscillator that basically tells you how far price has wandered from its own statistical average. Push past +100, and you're usually staring at a strong uptrend, maybe overbought territory. Drop below −100 and it flips: strong downtrend, possibly oversold.
The math behind it, if you ever need it, is CCI = (Typical Price minus the SMA of Typical Price) divided by (0.015 times Mean Deviation). Most people trade it through a handful of approaches: crossing ±100, overbought/oversold reversals, divergence, or watching for trend line breaks right on the indicator itself.
The standard setting is 14 periods, though bumping it up to 20 or 50 smooths things out if you're willing to trade some speed for it.
One thing worth remembering: don't lean on CCI by itself. Used alone, it'll whipsaw you in choppy, sideways markets more than you'd like. Pair it with something else, and it holds up a lot better.
And if you're buying physical commodities rather than trading charts, think of CCI as a timing check, something to glance at alongside real market prices, not a stand-in for fundamentals or your actual sourcing strategy.